heart-disease-prediction
Heart Disease Prediction
Overview
This project aims to develop a Machine Learning model to predict the presence of heart disease in a patient based on various health parameters. The model is trained using classification algorithms and evaluated using metrics like accuracy, precision, recall, and F1-score.
📂 Dataset
The dataset used in this project is heart.csv. Ensure it is placed in the same directory as the Jupyter Notebook before running the code.
If you don’t have the dataset, you can download it from Kaggle.
Source: Kaggle
Number of Samples: 303
Target Variable: target (1 = Heart disease, 0 = No heart disease)
Features:
| Feature | Description |
|———–|————|
| age | Age of the patient |
| sex | Gender (1 = Male, 0 = Female) |
| cp | Chest pain type (0-3, where 3 is most severe) |
| trestbps | Resting blood pressure (in mm Hg) |
| chol | Serum cholesterol (mg/dL) |
| fbs | Fasting blood sugar (1 = > 120 mg/dL, 0 = Normal) |
| restecg | Resting electrocardiographic results (0-2) |
| thalach | Maximum heart rate achieved |
| exang | Exercise-induced angina (1 = Yes, 0 = No) |
| oldpeak | ST depression induced by exercise relative to rest |
| slope | Slope of the peak exercise ST segment (0-2) |
| ca | Number of major vessels (0-3) colored by fluoroscopy |
| thal | Thalassemia (0-3, where 3 is abnormal) |
Project Steps
- Data Preprocessing
- Handling missing values
- Encoding categorical variables
- Normalizing numerical features
- Exploratory Data Analysis (EDA)
- Visualizing feature distributions
- Analyzing relationships between variables
- Model Training
Implementing various classification algorithms:- Logistic Regression
- Decision Tree
- Random Forest
- Model Evaluation
- Comparing accuracy, precision, recall, AUC, and F1-score
- Selecting the best-performing model
- Hyperparameter Tuning
- Optimizing model parameters for better performance
- Final Prediction
- Using the best-performing model to predict heart disease
📊 Results
✅ Best Model: Logistic Regression with Optimal Threshold
The evaluation metrics for the best-performing model are as follows:
- Precision: 0.8788
- Recall: 0.9062
- F1-Score: 0.8923
- Accuracy: (Include your accuracy score here)
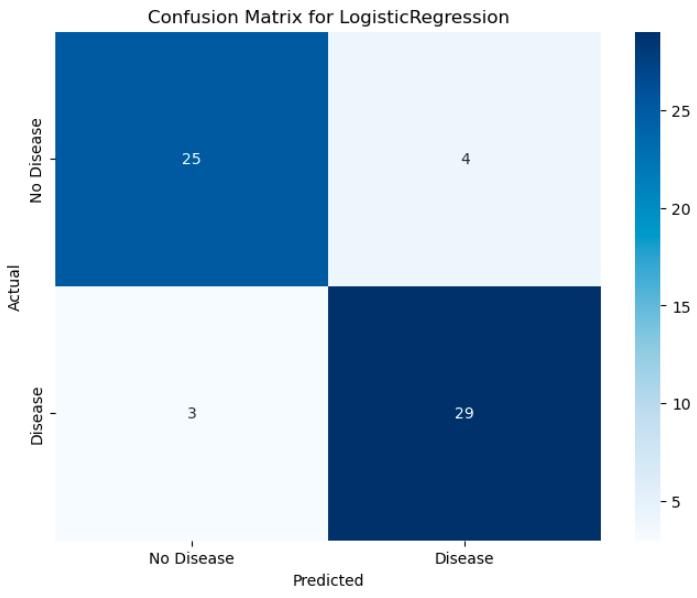
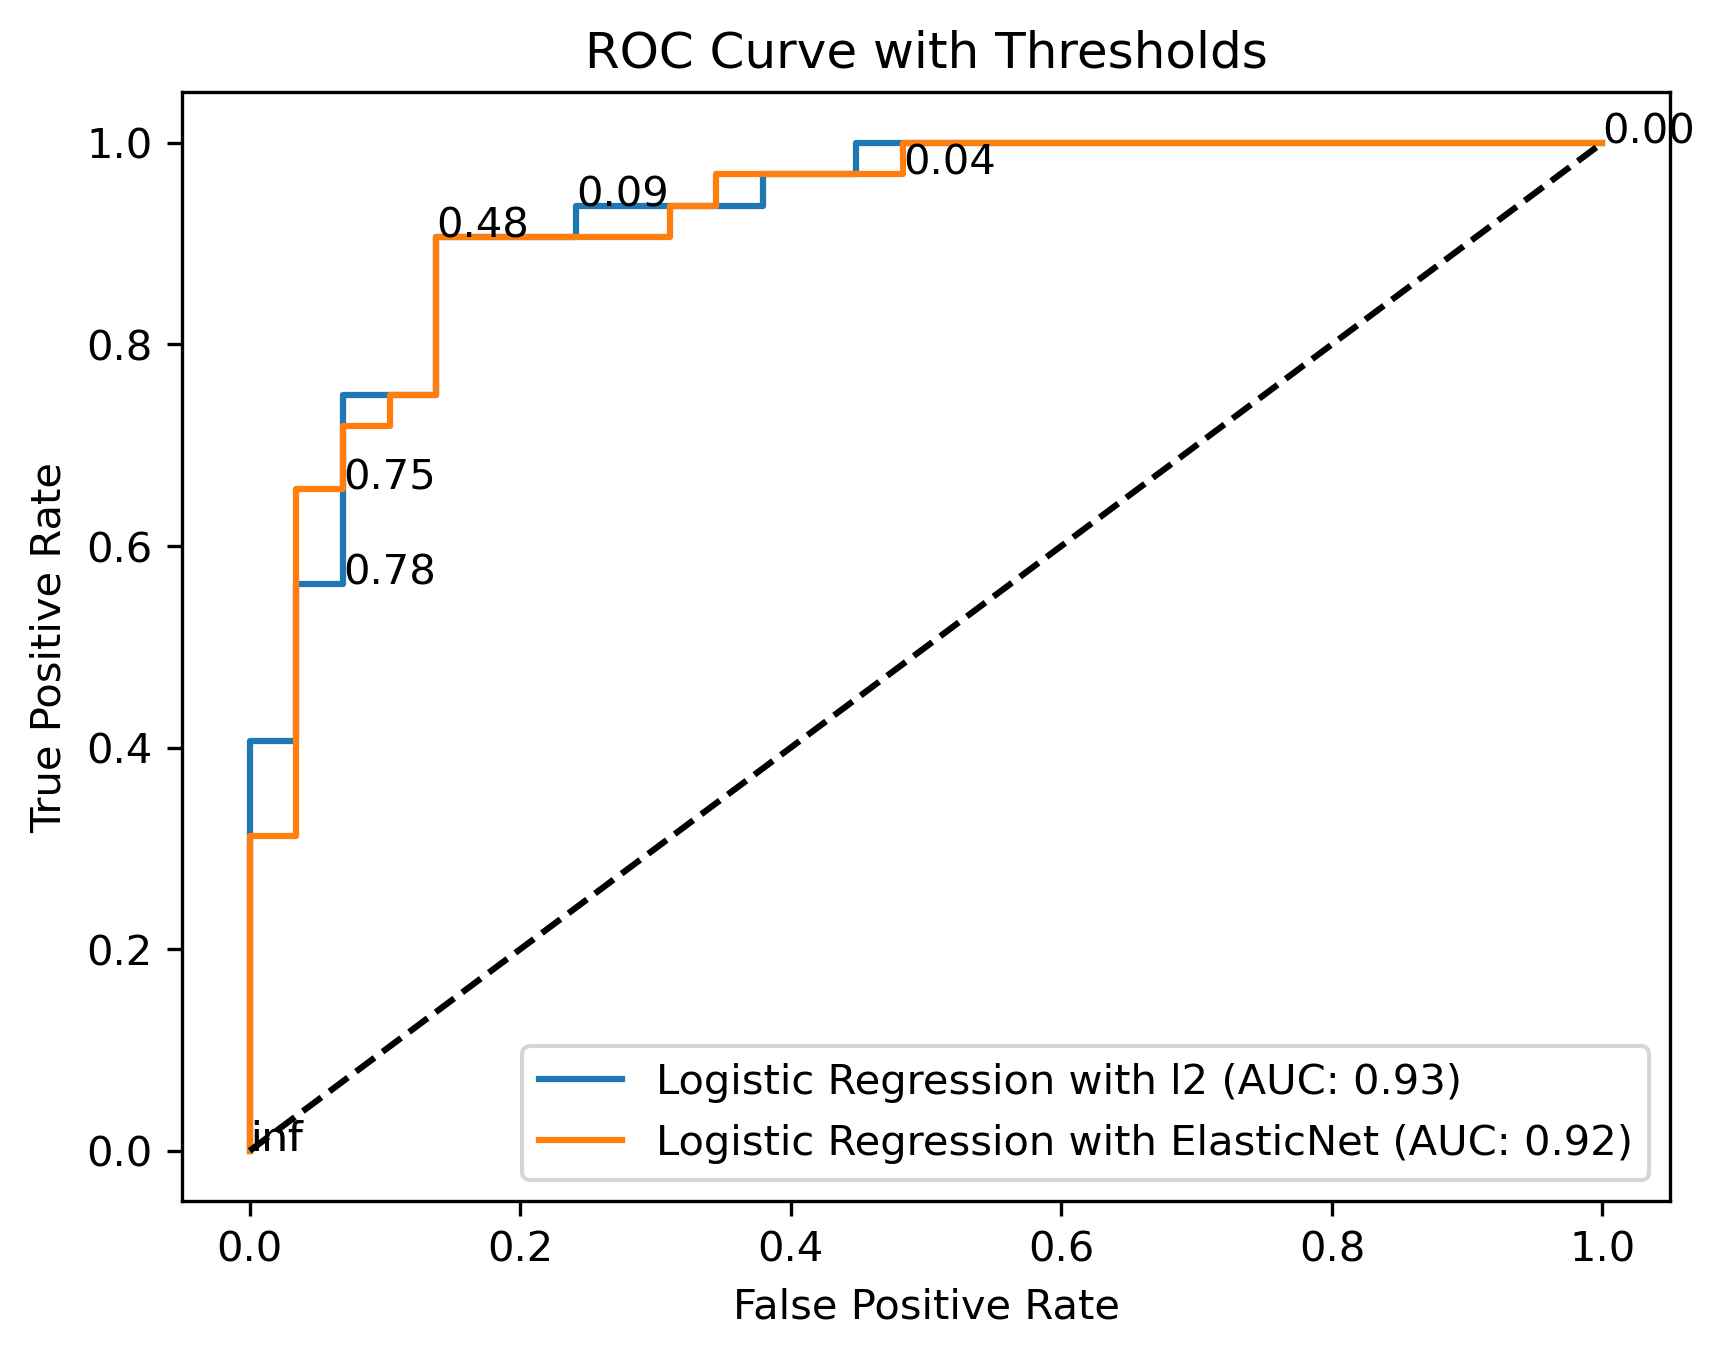
Additionally, the confusion matrix and ROC curve provide a visual representation of the model’s performance.
Confusion Matrix & ROC Curve
Below are the performance visualizations:
-
Confusion Matrix:
-
ROC Curve:
📌 How to Use This Project
1️⃣ Installation & Setup
To run this project locally, follow these steps:
- Clone this repository:
```bash git clone https://github.com/kanna-vamshi-krishna/heart-disease-prediction.git